Dashboard Overview
Welcome to your DeleevX Seller Dashboard.
The Dashboard is the central hub where you can manage every aspect of your business on DeleevX. It provides quick access to your store's performance, products, orders, earnings, customer activity, and business settings.
The Dashboard is divided into two main sections:
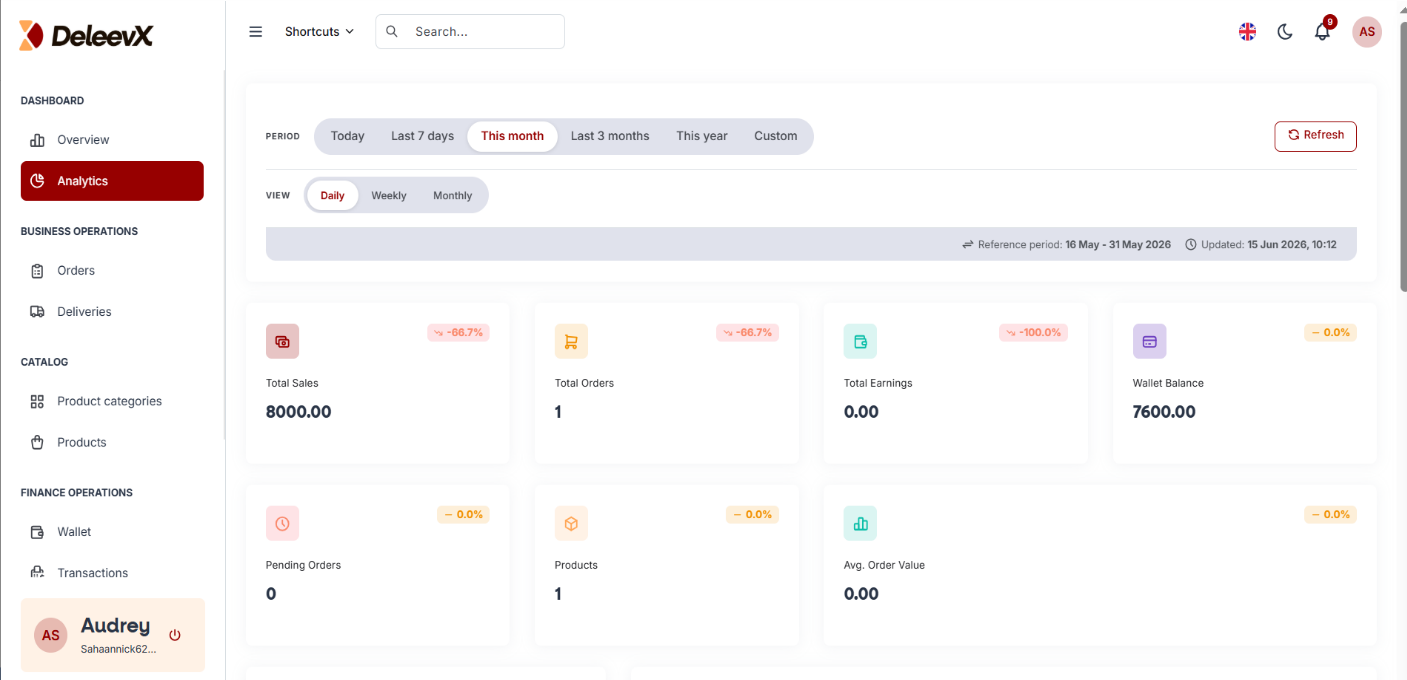
i. Analytics Section
The Analytics page provides a visual overview of your business performance based on the selected period (daily, weekly, monthly, or custom date range).
This section helps you monitor your store's growth and analyze important business metrics, including:
- Total Sales
- Total Orders
- Total Earnings
- Revenue Trends
- Business Performance Insights
- Other key statistics related to your store's activity
By reviewing these metrics regularly, you can better understand your customers' behavior and make data-driven decisions to improve your business performance.
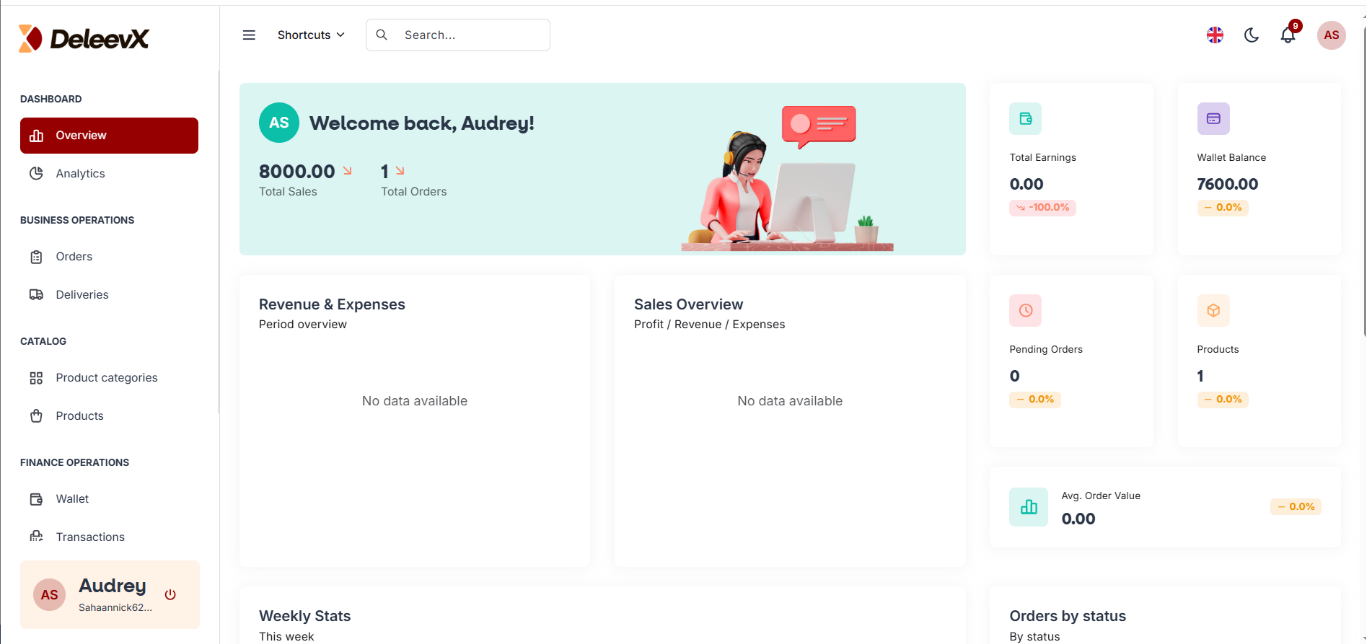
ii. Overview Section
The Overview page provides a simplified summary of your store's performance.
It highlights the most important information from the Analytics section, allowing you to quickly assess your business activity at a glance.
From this page, you can view:
- Sales Summary
- Order Summary
- Earnings Overview
- Overall Store Performance
- Key Performance Indicators (KPIs)
This section is ideal for obtaining a quick snapshot of your business without navigating through detailed reports.
Tip
Make it a habit to review both the Analytics and Overview sections regularly. Monitoring your store's performance will help you identify trends, optimize your operations, and make informed decisions to grow your business on DeleevX.